Hic Sunt Dracones
Survey of the Best Online Mapping Tools
Making your own maps is no longer a big undertaking, but for developers unfamiliar with web mapping, the choice can be daunting. You want to create maps, but you’re unsure where to start or which tools to use. I am here to help.
Here, I’ll discuss several of the best available tools, providing a brief overview of each, along with code examples, and weighing the pros and cons.
There’s nothing quite like a good, useful map.
Today, using online maps is an easy and engaging process. Making your own online maps is no longer a big undertaking; we have a wide range of available online mapping tools at our disposal, from free and straightforward to feature-rich and complex. For web developers not familiar with web mapping, the agony of choice might be intimidating. You want to make maps, but you’re unsure where to start or which tools to use. I am here to help with this list of the best mapping tools.
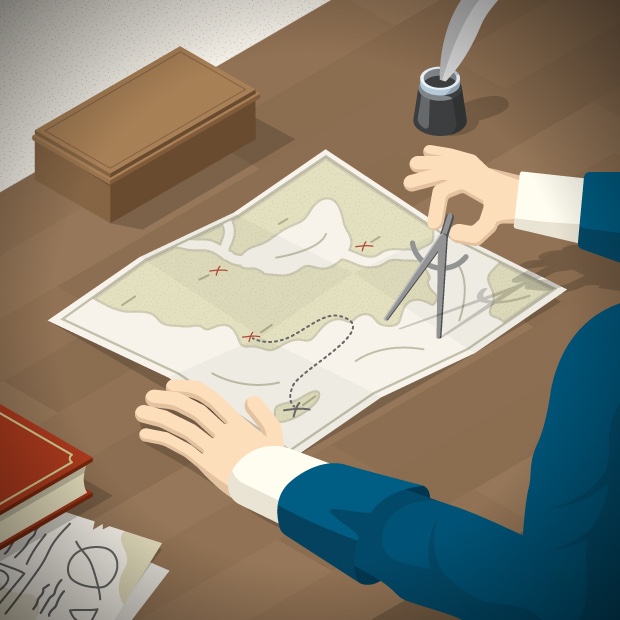 Mapping in the past.
A Little Bit of History
From its beginning, technology has had an influence on mapmaking and how maps are used. As technology progressed, cartography and mapmaking processes evolved with it, from manually drawn maps on papyrus to interactive maps on the web.
The second half of the 20th century was a turning point for cartography. Computers became a tool of choice. Aerial photography, satellite imagery, and remote sensing changed the way spatial data is gathered. Geographic Information Systems (GIS) were born. Eventually, GIS maps transitioned from desktop to web, and major GIS vendors began developing the first frameworks for online maps.
But GIS mapping is not easy. It requires many server-side technologies, geospatial standards, and protocols, along with their implementations. It requires understanding geospatial data and map projections, knowledge of how to gather the data, how to display the data, which colors to use, how to generalize the data to specific scales, how to place labels on the map, how to set up a server that will serve the maps, how to use a spatial database, and so on. GIS is full of abbreviations, such as WMS, WFS, EPSG, CRS, SLD, GML, TMS, just to name a few, and to know and understand them, you need to read books, academic papers, and articles.
The Evolution of Online Mapping
The first web maps typically showed only a single, tiny map image. At that time, panning was implemented by moving one step, usually by half of the map size, in one of eight possible compass directions - N, NW, W, SW, S, SE, E, NE. After the user clicked the pan or zoom button, a whole new image would need to be rendered on the map server, loaded over the network, and then processed by the browser. Due to technological constraints, maps only occupied a small part of the web page. To improve interaction, early maps required plugins such as Flash or proprietary Java-based plugins, or even ActiveX, which was compatible only with Internet Explorer.
Google turned the mapping world upside down when it introduced Google Maps in 2005. Among its innovations, Google introduced continuous panning by dragging. Their solution was to display a map sliced into many smaller square images called “tiles”. These tiles were rendered and served from a “map tile server,” and are usually 256 x 256 pixels. Zooming and panning now only require loading new map tiles instead of reloading the entire web page. The result was a larger, more visible map that spanned over half of the browser window, providing a smooth experience for map exploration. Because of the ability to “slip” the map around with the smooth zooming and panning functions, these new maps were called “slippy maps”. Google also allowed scripting, so users could put Google’s maps on their own websites and add their own data to the map. This resulted in another new term being coined: “Map mash-ups.”
Suddenly, online maps became popular; to add a nice-looking map to your website, you no longer needed to be a cartographer or a GIS specialist. On the wings of the “Web 2.0” movement, and building off modern technologies like HTML5, CSS3, and SVG, which enable easy creation of interactive content, interactive maps are now living a new renaissance.
 Mapping in the future?
Map Data
As mentioned before, early online maps were based on sets of GIS data and their spatial geodatabases. Not many people had access to that data, not to mention its price tag. Google and the OpenStreetMap (OSM) project datasets changed that. Google’s database is private and comes with restrictions, while OSM was inspired by the concept of Wikipedia, as a collaborative project to create a free map of the world. OpenStreetMap is built by a community of volunteer mappers, who contribute to and maintain the spatial data.
In short, the biggest revolution that contributed to easy mapmaking today is that the trouble related to maintaining a map server and the spatial database has been removed.
Choosing a Web Mapping Framework
So, with all the options, how do we choose the right online mapping tool? On the one hand, there are commercial online map providers like Google, MapQuest, Microsoft, and Nokia. These services provide map tiles and proprietary JavaScript APIs to view them and interact with a map. On the other hand, there are open-source mapping projects that offer easy loading of OpenStreetMap-based map tiles. These include OpenLayers and Leaflet. And then there are projects such as MapBox and Carto, which base their business models on the open source libraries and OSM data, and provide added value, but are not free.
Let’s take a look at some examples from each of these categories. Here, I’ll discuss several of these online mapping tools, providing a brief overview of each, along with code examples, and weighing the pros and cons. I also wrote a D3.js mapping tutorial that you might find interesting as a separate read.
Google Maps
Let’s start with the most obvious choice, Google Maps. The first version of the Google Maps API was introduced in February 2005, and the current Google Maps API v3 was released in June 2009. The Google Maps API is not just the JavaScript API endpoint; it includes more projects and offers several different ways to embed Google Maps into web pages with extensive customization.
The current available Google Maps APIs include:
- Google Maps JavaScript API
- Google Static Maps API
- Google Maps Embed API
- Google Maps SDK for iOS
- Google Maps Android API
To help you pick the right API, Google developed an API picker.
It is worth noting that while the basic APIs are free, there are some limitations imposed. If you need larger scales or want a private map, or you are running an enterprise or commercial website, consider paying for Google Maps Premium Plan.
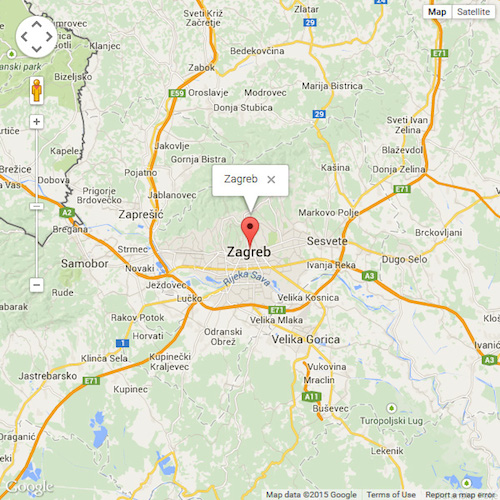
Implementation
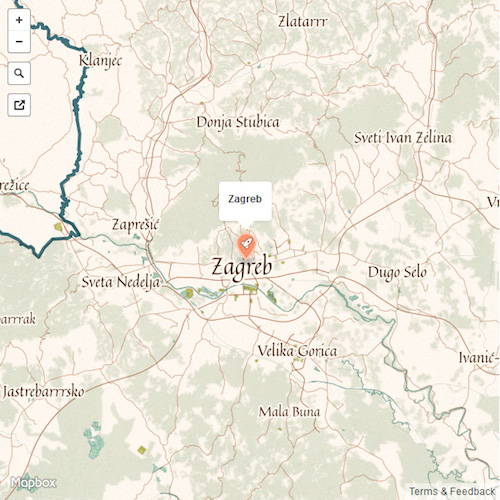
Here’s an example of how to implement a simple Google map in code. It shows how to create a simple map using the API, place a marker on the map, and open a pop-up with a mouse click.
<!DOCTYPE html>
<html>
  <head>
	<meta charset="utf-8">
	<script src="http://maps.google.com/maps/api/js?sensor=false"></script>
  </head>
  <body>
	<div id="map" style="width: 600px; height: 600px;"></div>
	<script type="text/javascript">

	  var map = new google.maps.Map(document.getElementById('map'), {
		zoom: 10,
		center: new google.maps.LatLng(45.8167, 15.9833),
		mapTypeId: google.maps.MapTypeId.ROADMAP
	  });

	  var infowindow = new google.maps.InfoWindow();

	  var marker = new google.maps.Marker({
		position: new google.maps.LatLng(45.8167, 15.9833),
		map: map
	  });

	  google.maps.event.addListener(marker, 'click', (function(marker) {
		return function() {
		  infowindow.setContent("Zagreb");
		  infowindow.open(map, marker);
		}
	  })(marker));

	</script>
  </body>
</html>
Pros
- Big community of users.
- Developed and maintained by Google.
- Excellent API documentation, with lots of examples.
- Lots of different APIs for including a map in your website or application.
Cons
- Closed and proprietary API.
- Unclear pricing for Google Maps Premium Plan.
- Are we sure that we won’t see ads at some point?
- Everyone is using it; all maps (mostly) look the same.
- No plugins besides those officially developed by Google.
OpenLayers
OpenLayers was developed by MetaCarta as an open-source equivalent to Google Maps, and the first version was published in June 2006. OpenLayers is an open-source mapping tool that implements a JavaScript API for building rich web-based geographic applications, with an API similar to the Google Maps API. OpenLayers gained a lot of traction very fast, and development in the beginning was rapid. OpenLayers 2 was released only two months after version 1, in August 2006. The library was constantly under development, with new versions and features being added regularly. The downside of this rapid progress was that the version 2 library became very big and clunky, eventually reaching 1MB in size and containing over 100,000 lines of code! While it came with a lot of features, not all were needed by regular users.
This was the primary reason for a comprehensive rewrite of its library. The goal was to target the latest HTML5 and CSS3 features, with the same functionality from OpenLayers 2, such as support for projections, standard protocols, and editing functionality. The primary focus was on performance improvements, lighter builds, prettier visual components, and a better API. This much-improved OpenLayers 3 was published in August 2014.
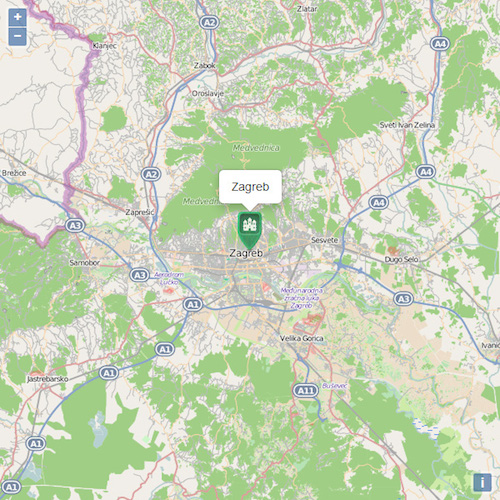
Implementation
Let’s see how the same map as in the previous example, this time using OpenLayers 3.
<!DOCTYPE html>
<html>
  <head>
	<meta charset="utf-8">
	<script src="http://openlayers.org/en/v3.2.1/build/ol.js"></script>
	<link rel="stylesheet" href="http://openlayers.org/en/v3.2.1/css/ol.css" type="text/css">
	<script src="http://openlayers.org/en/v3.2.1/resources/jquery.min.js"></script>
	<script src="http://openlayers.org/en/v3.2.1/resources/bootstrap/js/bootstrap.min.js"></script>
	<link rel="stylesheet" href="http://openlayers.org/en/v3.2.1/resources/bootstrap/css/bootstrap.min.css" type="text/css">
  </head>
  <body>
	<div id="map" class="map" style="width: 600px; height: 600px;">
	  <div id="popup" style="padding-bottom: 45px;"></div>
	</div>
	<script type="text/javascript">

	  var iconFeature = new ol.Feature({
		geometry: new ol.geom.Point(ol.proj.transform([15.9833, 45.8167], 'EPSG:4326', 'EPSG:3857')),
		name: 'Zagreb',
	  });
	  var iconStyle = new ol.style.Style({
		image: new ol.style.Icon(/** @type {olx.style.IconOptions} */ ({
		  anchor: [0.5, 46],
		  anchorXUnits: 'fraction',
		  anchorYUnits: 'pixels',
		  opacity: 0.75,
		  src: 'http://ol3js.org/en/master/examples/data/icon.png'
		}))
	  });
	  iconFeature.setStyle(iconStyle);

	  var vectorSource = new ol.source.Vector({
		features: [iconFeature]
	  });

	  var vectorLayer = new ol.layer.Vector({
		source: vectorSource
	  });

	  var map = new ol.Map({
		target: document.getElementById('map'),
		layers: [
		  new ol.layer.Tile({
			source: new ol.source.OSM()
		  }),
		  vectorLayer
		],
		controls: ol.control.defaults(),
		view: new ol.View({
		  center: ol.proj.transform([15.9833, 45.8167], 'EPSG:4326', 'EPSG:3857'),
		  zoom: 10
		})
	  });

	  var element = document.getElementById('popup');
	  var popup = new ol.Overlay({
		element: element,
		positioning: 'bottom-center',
		stopEvent: false
	  });
	  map.addOverlay(popup);

	  map.on('click', function(evt) {
		var feature = map.forEachFeatureAtPixel(evt.pixel,
			function(feature, layer) {
			  return feature;
			});
		if (feature) {
		  var geometry = feature.getGeometry();
		  var coord = geometry.getCoordinates();
		  popup.setPosition(coord);
		  $(element).popover({
			'placement': 'top',
			'html': true,
			'content': feature.get('name')
		  });
		  $(element).popover('show');
		} else {
		  $(element).popover('destroy');
		}
	  });

	  map.on('pointermove', function(e) {
		if (e.dragging) {
		  $(element).popover('destroy');
		  return;
		}
		var pixel = map.getEventPixel(e.originalEvent);
		var hit = map.hasFeatureAtPixel(pixel);
		map.getTarget().style.cursor = hit ? 'pointer' : '';
	  });

	</script>
  </body>
</html>
Pros
- Plenty of examples.
- Free and open source.
- Feature-packed library for your mapping needs.
- Support for a range of data types and GIS standards.
- Built-in support for map projections and editing features.
Cons
- Version 3 is still in heavy development, and the API is still changing with every point release.
- Version 3 documentation is currently not as thorough as it could be.
- Complicated API syntax.
Leaflet
It is safe to say that Leaflet was born as a reaction to OpenLayers’ bloat, clutter, and complexity. Vladimir Agafonkin was asked to build a wrapper around OpenLayers, but he instead created a lightweight and straightforward OpenLayers alternative, and in May 2011, Leaflet was born. Vladimir focused on simplicity, performance, and usability for this online map tool. The core library has only basic functionality, which is enough for most real-life use cases. Still, Leaflet can be extended with a vast number of plugins that are easy to develop and add on top of the core library. Additionally, Leaflet was crafted from scratch with mobile support in mind.
Leaflet is easy to use and has a well-documented API, along with simple source code that is available on GitHub. As a result of its focus on performance, usability, simplicity, small size, and mobile support, it is significantly less complicated than OpenLayers.
Leaflet’s future is looking interesting, too. According to Vladimir, the next major release will be even simpler, with improved performance and an upgraded plugin infrastructure.
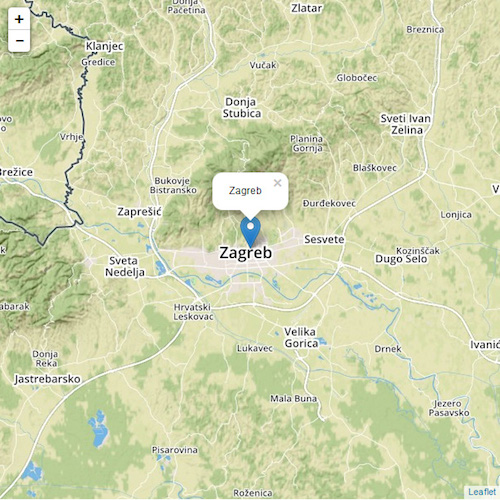
Implementation
Here’s the same map as before, implemented using Leaflet once again.
<!DOCTYPE html>
<html>
  <head>
	<meta charset="utf-8">
	<script src="http://cdn.leafletjs.com/leaflet-0.7.3/leaflet.js"></script>
	<link rel="stylesheet" href="http://cdn.leafletjs.com/leaflet-0.7.3/leaflet.css" />
  </head>
  <body>
	<div id="map" style="width: 600px; height: 600px;"></div>
	<script type="text/javascript">

	  var map = L.map('map').setView([45.8167, 15.9833], 10);
	  var mbUrl = 'https://{s}.tiles.mapbox.com/v3/{id}/{z}/{x}/{y}.png';
	  L.tileLayer(mbUrl, {id: 'examples.map-i875mjb7'}).addTo(map);
	  var marker = L.marker([45.8167, 15.9833]).bindPopup("Zagreb").addTo(map);

	</script>
  </body>
</html>
Pros
- Small and fast.
- Mobile friendly.
- Free and open source.
- Simple and easy API syntax.
- Good for getting an online map up quickly and easily.
- Plenty of examples with excellent documentation.
Cons
- Lack of advanced functionality.
MapBox
A startup named MapBox is trying to revolutionize the online cartographic marketplace to build better-looking, more versatile online maps. Mapbox GL JS is a client-side JavaScript library for building web maps and web applications with Mapbox’s modern mapping technology. Besides the JavaScript API, here are some other available MapBox services:
- Maps SDK for iOS
- Maps SDK for Android
- Maps SDK for Flutter
- Mapbox Studio to create custom maps
- Geocoding API
- Directions API
MapBox offers not only its mapping service but also access to the data, including privately acquired satellite images, open data from NASA, and community-driven world data from OpenStreetMap.
Many big companies have recognized the benefits that MapBox provides, and are using it on their own sites. They include Foursquare, Evernote, Pinterest, The Financial Times, GitHub, and Etsy, to name a few.
Implementation
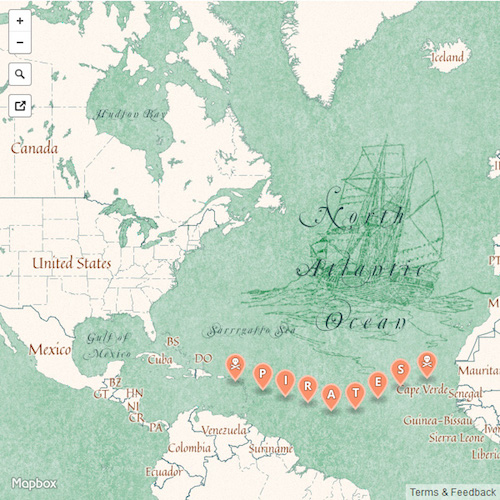
Here’s an example of a slick MapBox map using a style called Pirates, created by MapBox’s designers:
This style is done using their MapBox Studio. With MapBox Studio, you can create your own map styles from scratch or modify and extend existing styles created by other designers. Once your custom map is uploaded to your MapBox account, you can embed it on your site using the MapBox API.
The following is a sample of the CartoCSS used to get the Pirates baselayer:
@name: '[name_en]';
@name_arrr: "[name_en].replace('([Aa]r)','\1rr')";
@land: #fff8f0;
@water: #cdd;
@park: #cda;

Map {
  background-color:@land;
  background-image:url(img/noise.png);
}

#admin[maritime=0][zoom>=3] {
  line-join: round;
  line-color: #478;
  comp-op:multiply;
  // Countries
  [admin_level=2] {
	line-cap:round;
	line-width: 0.8;
	[zoom>=6] { line-width: 2; }
	[zoom>=8] { line-width: 4; }
	[disputed=1] {
	  line-dasharray: 4,4;
	  line-cap:butt;
	}
  }
  // States / Provices / Subregions
  [admin_level>=3] {
	line-width: 0.4;
	line-dasharray: 10,3,3,3;
	[zoom>=6] { line-width: 1; }
	[zoom>=8] { line-width: 2; }
	[zoom>=12] { line-width: 3; }
  }
}

@water_line:lighten(@water,8);
#water {
  ::b {
	polygon-pattern-file:url(img/water.png);
  polygon-pattern-alignment:global;
  }
  polygon-fill: mix(@water,#fff,50);
  polygon-gamma: 0.6;
  comp-op:multiply;
  a/line-color:@water_line;
  a/line-width:-0.4;
  a/line-comp-op:multiply;
  a/line-smooth:2;
  b/line-color:@water_line;
  b/line-width:-0.4;
  b/line-comp-op:multiply;
  b/line-smooth:4;
  c/line-color:@water_line;
  c/line-width:-0.4;
  c/line-comp-op:multiply;
  c/line-smooth:6;
  [zoom>=12] {
	a/line-width:0.8;
	b/line-width:0.8;
	c/line-width:0.8;
  }
}

#waterway {
  comp-op:multiply;
  [type='river'],
  [type='canal'] {
	line-color: @water;
	line-width: 0.5;
	[zoom>=12] { line-width: 1; }
	[zoom>=14] { line-width: 2; }
	[zoom>=16] { line-width: 3; }
  }
  [type='stream'] {
	line-color: @water;
	line-width: 0.5;
	[zoom>=14] { line-width: 1; }
	[zoom>=16] { line-width: 2; }
	[zoom>=18] { line-width: 3; }
  }
}

#landuse {
  ::glow {
	comp-op:multiply;
	[class='park'],[class='pitch'],[class='school'] {
	  line-width:2;
	  line-join:round;
	  [class='park'] { line-color:#ddb; }
	  [class='pitch'] { line-color:#eed; }
	  [class='school'] { line-color:#edb; }
	}
  }
  ::main[zoom>=0] {
	comp-op:multiply;
	[class='park'] {
	  polygon-pattern-file:url(img/park.png);
	  polygon-pattern-alignment:global;
	}
	[class='school'] {
	  polygon-fill:#ed9;
	  polygon-opacity:0.5;
	}
  }
  ::wood[class='wood'] {
	line-color:#C3CFB4;
	line-opacity:0.33;
	line-width:3;
	line-join:round;
	polygon-pattern-file:url(img/forest.png);
	polygon-pattern-alignment:global;
	comp-op:multiply;
	opacity:0.5;
  }
}

#building {
  polygon-fill:#efe8d8;
  comp-op:multiply;
  [zoom>=15] {
	line-color:#efe8d8 * 0.9;
	[zoom>=15] { line-width:0.2; }
	[zoom>=16] { line-width:0.4; }
	[zoom>=17] { line-width:0.8; }
  }
}

#tunnel { opacity: 0.5; }

#road,
#tunnel,
#bridge {
  ['mapnik::geometry_type'=2] {
	line-width: 1;
	line-color:#edc;
	line-comp-op:multiply;
	[class='motorway'],
	[class='main'],
	[class='motorway_link']{
	  line-color:#dba;
	  [zoom>=10] { line-width: 1; }
	  [zoom>=12] { line-width: 2; }
	  [zoom>=14] { line-width: 3; }
	  [zoom>=16] { line-width: 5; }
	}
	[class='street'],
	[class='street_limited'] {
	  [zoom>=13] { line-width: 1.4; }
	  [zoom>=14] { line-width: 2; }
	  [zoom>=16] { line-width: 3; }
	}
	[class='street_limited'] { line-dasharray: 4,1; }
	[class='path'] { line-dasharray: 3,2; }
  }
}
Arrgh, matey!
Pros
- Detailed terrain data.
- Plenty of connected services.
- Beautifully designed maps out of the box.
- Big repository of detailed and cloudless satellite images.
- Graphical interface for styling and customizing existing maps.
Cons
- Not all the goodies are free.
- Pricing is based more on traffic than features.
Carto
For more complex geospatial data visualization and analysis, Carto is one of the best tools out there. It’s a cloud service that stores geographic data in a spatially-enabled database in the cloud called PostGIS, providing tools to access the data, analyze it using the spatial and geolocation powers of PostGIS.
Carto was created in response to the lack of alternatives for easy geospatial data visualizations and storage. Consequently, Carto is an alternative to Google’s Fusion Tables. Users can import data sets in various formats, such as CSV, KML, or Excel tables, and then layer them over maps from standard sources like Google, Here (Nokia), or OpenStreetMap. Since all the geodata is stored in a real database, the data can be accessed and queried with SQL, and then styled with CSS.
The Carto service is offered as “freemium.” Users who leave their data open to the public can host their projects at the Carto website for free. To store private data, import more than 5MB of data, or use more than five tables, users must subscribe to a premium plan.
GeoJSON
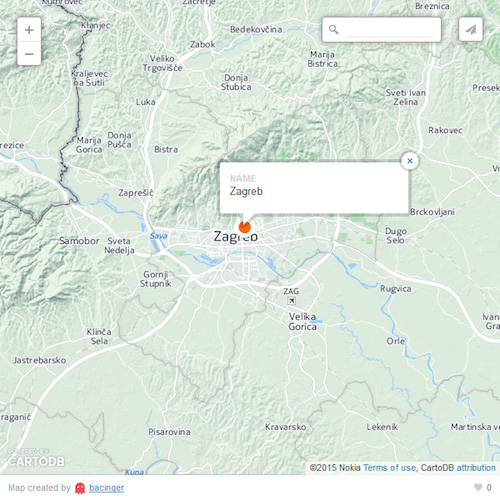
Carto is a tool for data visualization, so it is used differently than other online mapping tools. Your Carto map will automatically visualize any data that has georeferenced coordinates on the map. So we can show a label for Zagreb by simply adding it to our PostGIS database. Here’s an example formatted in GeoJSON:
{
	"type": "FeatureCollection",
	"features": [
		{
			"type":"Feature",
			"geometry": {
				"type":"Point",
				"coordinates":[15.9833,45.8167]
			},
			"properties": {
				"cartodb_id":1,
				"name":"Zagreb",
				"description":null,
				"created_at":"2015-02-20T21:02:16Z",
				"updated_at":"2015-02-20T21:03:59Z"
			}
		}
	]
}
Pros
- Great for managing and storing geospatial data.
- Supports lots of data formats and large datasets.
- Based on proven open source products, such as Leaflet and PostGIS.
Cons
- Not free.
- Pricing is based on the stored data size, which can get expensive if massive datasets are used.
Other Options for Web Developers
These are the most popular mapping frameworks currently available, but there are other lesser-known options in the wild. If you are tied to the Microsoft ecosystem, they offer an API similar to Google Maps called Azure Maps.
And, we cannot go without mentioning a dinosaur in the online mapping world, MapQuest.
Styling Your Maps
All these frameworks offer a way to customize the style and appearance of your maps. MapBox and Carto offer styling using CSS or a variation of CSS.
On the Google front, version 3 of the Google Maps API introduced custom-styled maps. This finally allowed developers, especially designers, more room to customize the default Google Maps design seen everywhere and bring it more in line with a website’s overall visual theme. Within the rich Google Maps community, a few styling resources have been born. The most notable is Snazzy Maps, a community of people creating custom styles for Google Maps and sharing them free of charge.
If you choose OpenLayers or Leaflet, you are limited to pre-rendered map tiles. Fortunately, there is a different range of map tiles to choose from, from Google, Nokia, Bing, or default OSM tiles, to those specially created by designers, such as Stamen. To get a feeling for how many available map tiles exist, or how they look compared to each other, visit Map Compare.
Wrap Up
Each of the best online mapping tools listed here has its strengths and weaknesses. For example, the code examples show the simplicity of using Leaflet versus the complexity that OpenLayers brings. However, Leaflet won’t solve your complex spatial problems, whereas OpenLayers will. The choice comes down to what your needs are.
To summarize:
- Google Maps - Well-rounded, established mapping solution, especially for non-developers to get a basic map on the web, along with all the powers that Google is (in)famous for.
- OpenLayers - For situations when other mapping frameworks can’t solve your spatial analysis problems.
- Leaflet - Currently, easily the best mapping framework for general mapping purposes, especially if you don’t need the additional services that MapBox or Carto provide.
- MapBox - A fast-growing and market-changing mapping solution for when you want more control over map styling or need services that others are not providing, such as detailed satellite images, geocoding, or directions.
- Carto - If you have heavy datasets, stored in different data formats, look no further.