Hic Sunt Dracones
earth - Global Wind Map
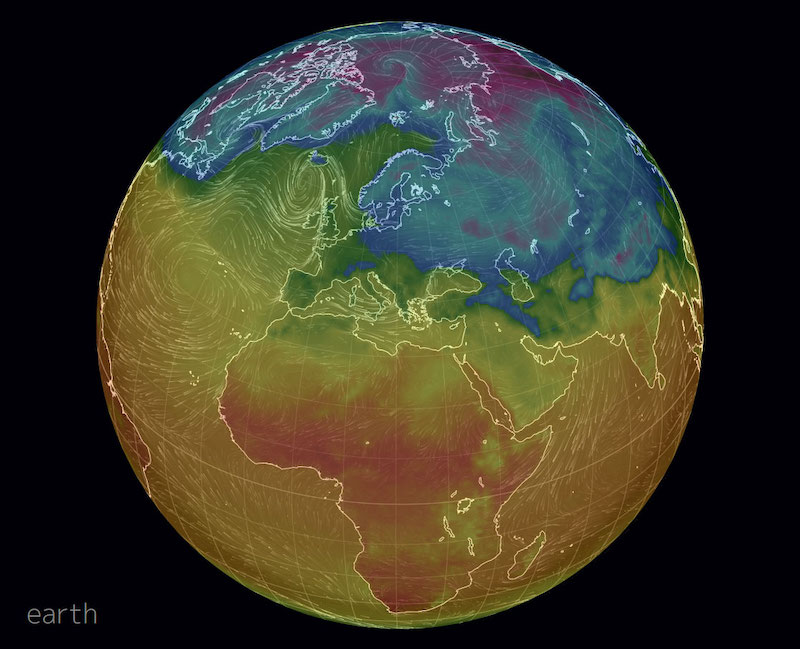
“earth”, a global wind map of the entire world, is a visualization of global weather conditions, created by Cameron Beccario.
It is based on the weather forecasts made by supercomputers of the National Centers for Environmental Prediction, NOAA, and National Weather Service.
The visualization works by first using an automated script to download and process Global Forecast System weather data in GRIB2 format every three hours, convert the data to JSON, and then push them to a static host. JSON data are calculated and interpolated in users’ browsers and finally shown as a rendered animated 3D wind map.
The wind is represented by green to red to purple gradients, where purple ones represent greater wind velocity, and the flow of the lines indicates wind direction. You can pull and drag the Earth around its axis with a mouse, while clicking on any location will show the clicked coordinates and wind speed at that location. You can customize displayed data, such as the heights for the wind velocity readings, change overlayed data, and even change the Earth projection!
It is worth noting that the project “earth” was built using only JavaScript frameworks, namely D3.js, When.js, Backbone.js, Node.js.